About the map
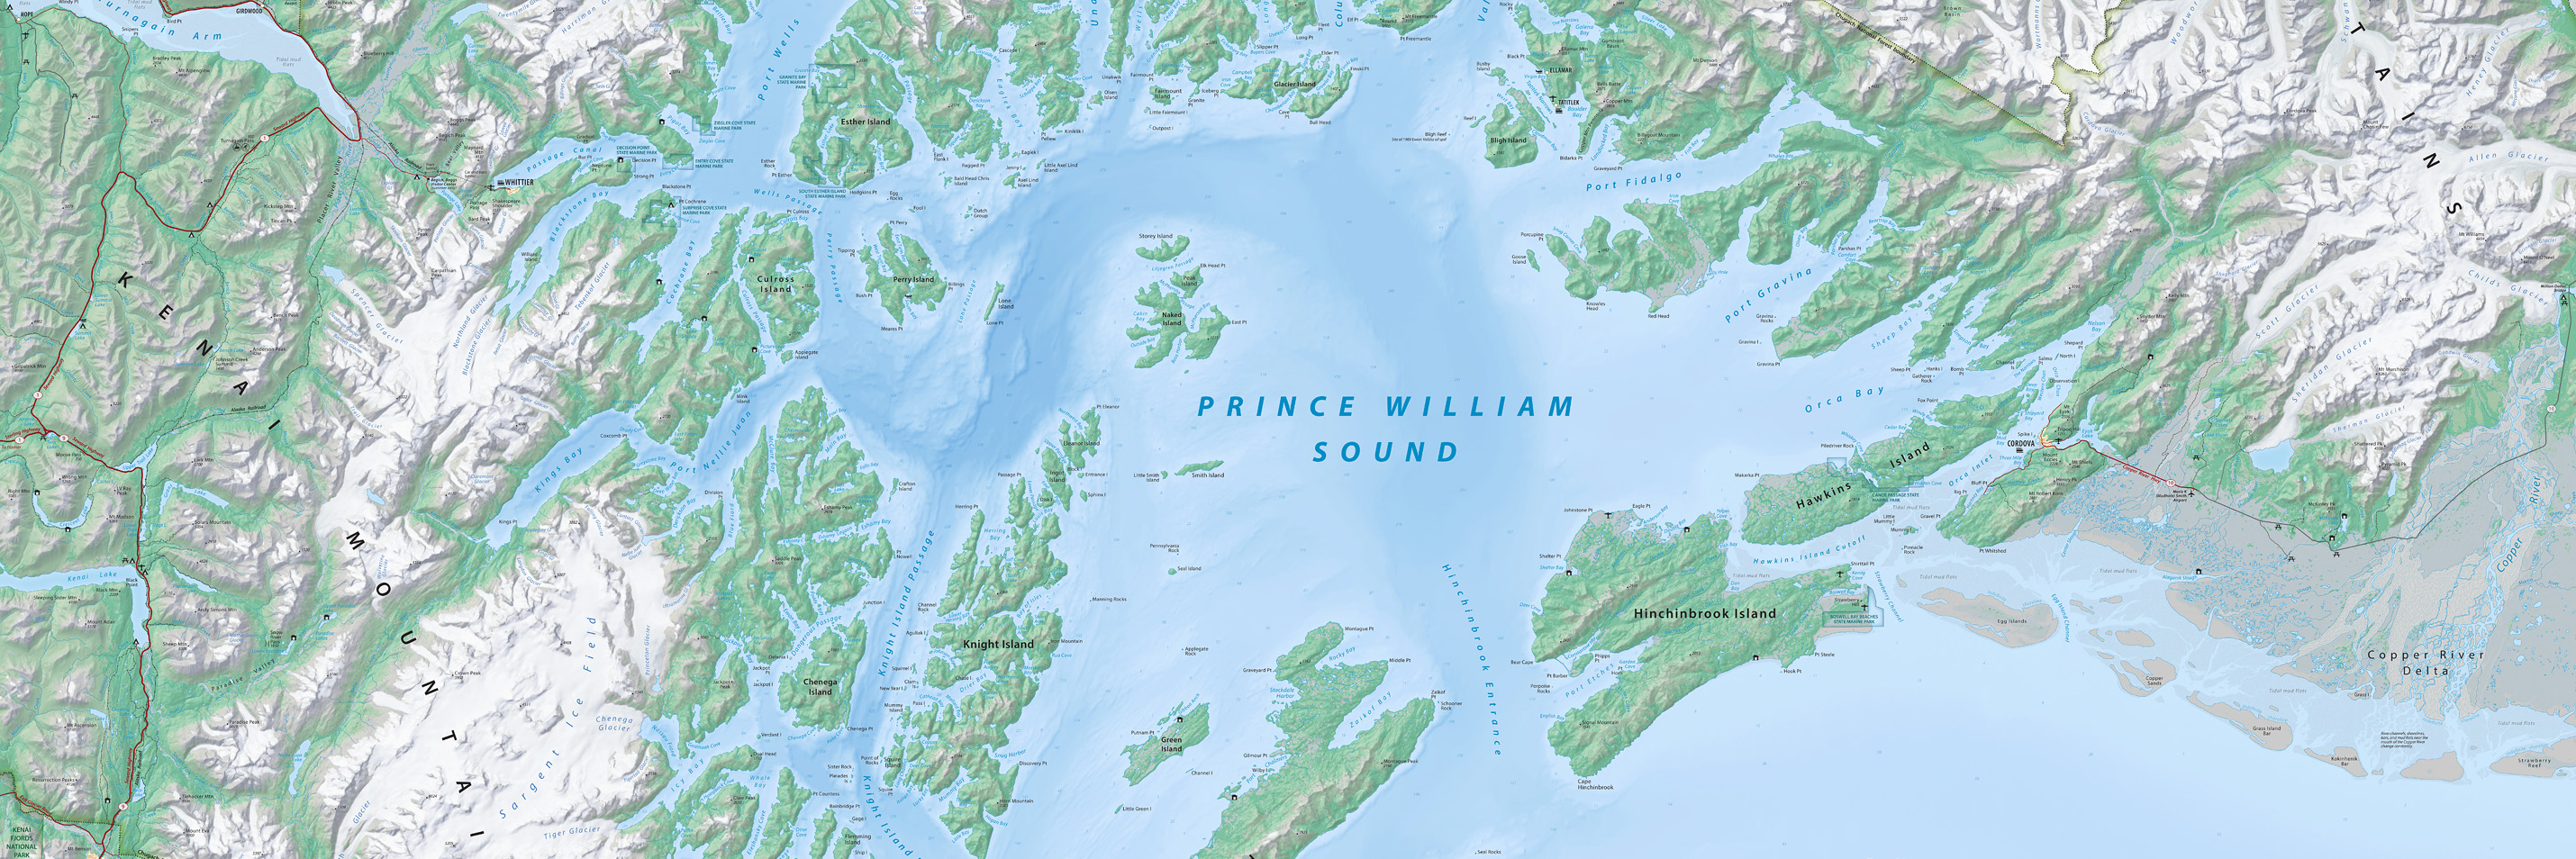
As a cartographer and admirer of Alaskan landscapes, I have always been fascinated by the intermingled islands, fjords, glaciers, and mountains of Prince William Sound. I started this map in February 2019 and finished it nine months later, working on and off. My aim was to make a physical map showcasing this magnificent place.
Prince William Sound turned out being the most laborious map that I have ever made. The culprit: climate change. Although much of the data that went into making the map was of recent vintage, glaciers in the region have melted noticeably these last few years.
Updating physical features—glaciers, coastlines, rivers, and lakes—from recent satellite images took up ninety percent of my time. Nevertheless, the completed map is only a snapshot in time. Columbia Glacier, for example, receded two miles (three kilometers) betwen 2019 and the most recent update in 2023. Much of what the map depicts will be out-of-date again before too long.
Enjoy it while it lasts!
Get the map—pick a file type depending on what you need to do
Last update: Version 1.2, October 22, 2023 Change log
Screen viewing and high-quality printing:
RGB JPEG image, 44 x 36 inches, 350 DPI, 49 MB
Prince William Sound • Wall Map
Modifying the map:
Layered Adobe Illustrator CC file with MAPublisher georeferencing, includes terrain art, 282 MB
Additional files for GIS and mapmaking
Georeferenced raster map GeoTIF, 199 MB
Terrain art without type GeoTIF, 115 MB
Data sources
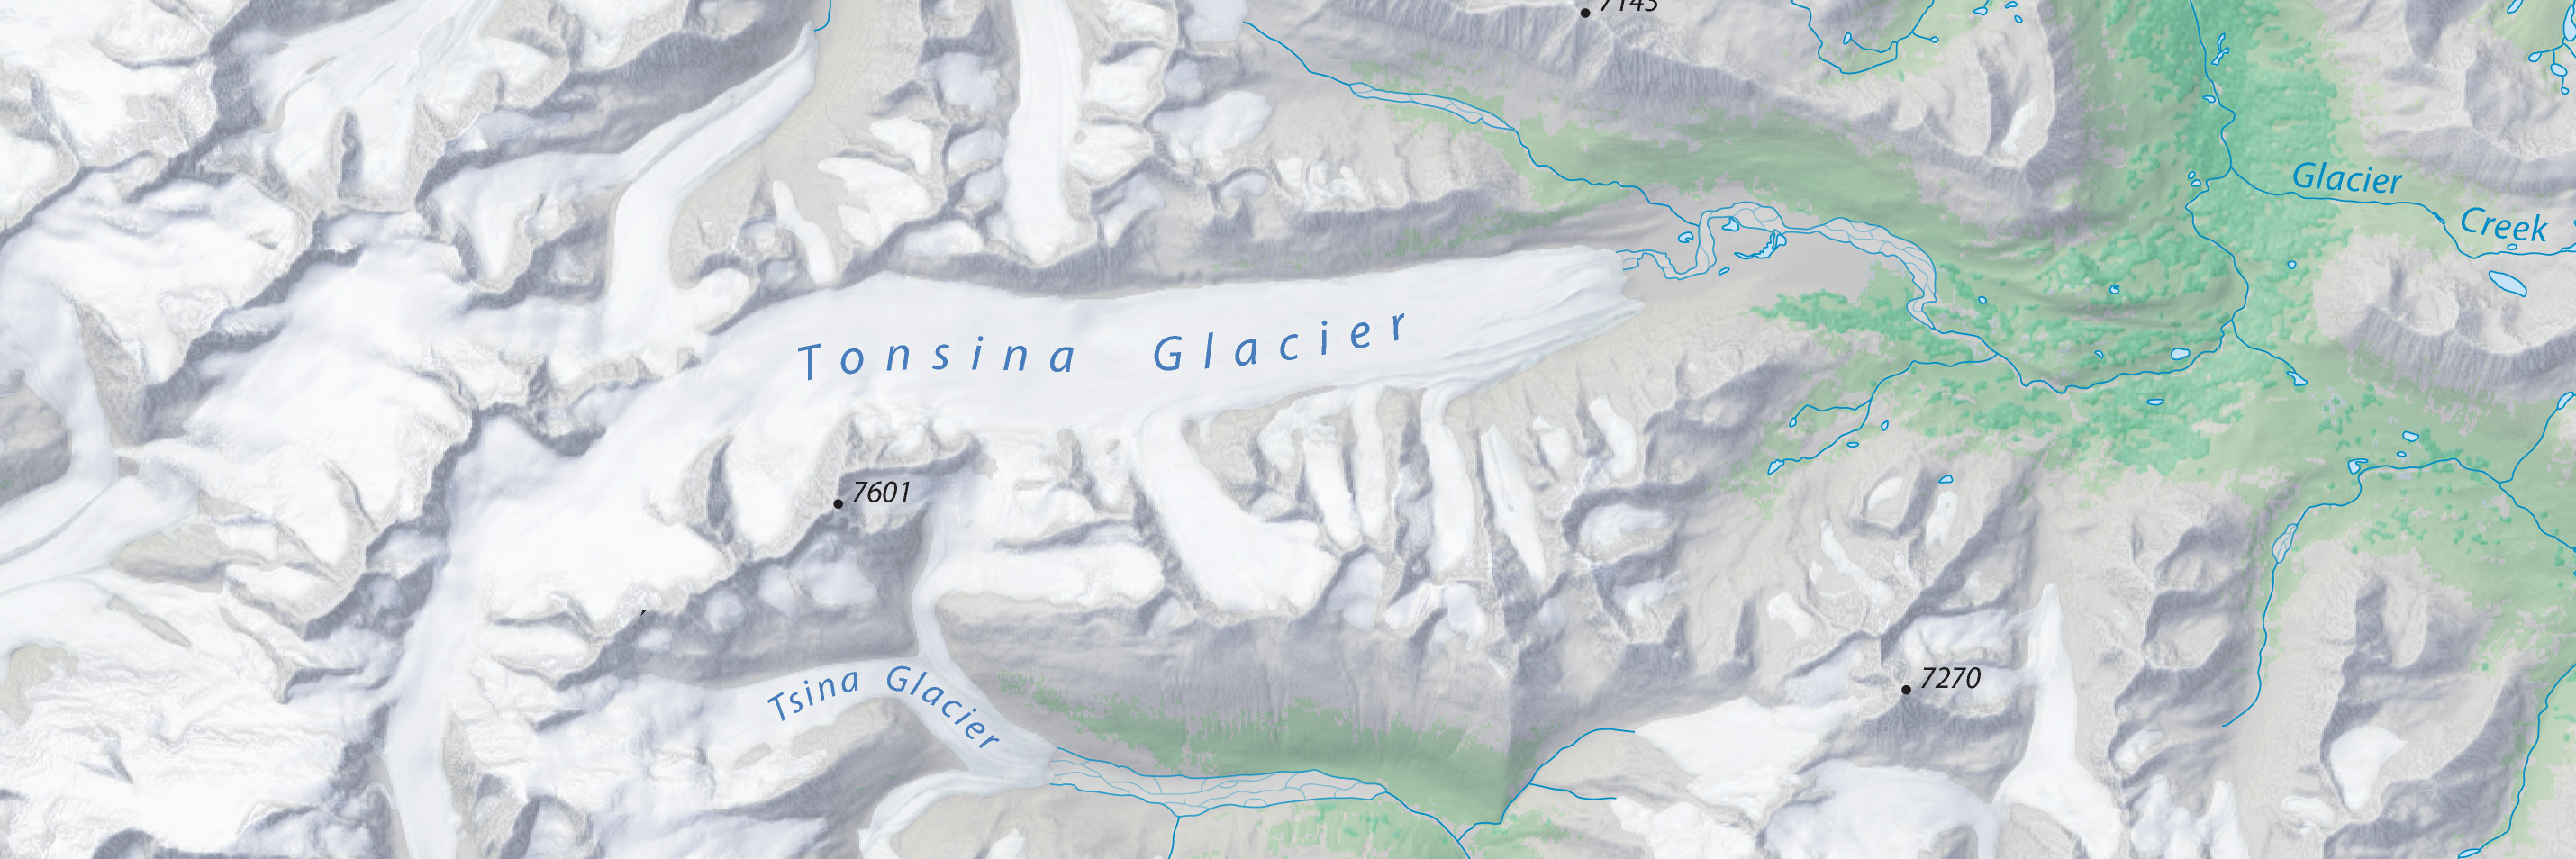
Shaded relief - National Elevation Dataset, 5-meter IFSAR DEM, collected in 2012 and 2014. Upper elevations derive from the IFSAR DEM downsampled to 15 meters. Lower elevations derive from the same DEM downsampled to 50 meters.
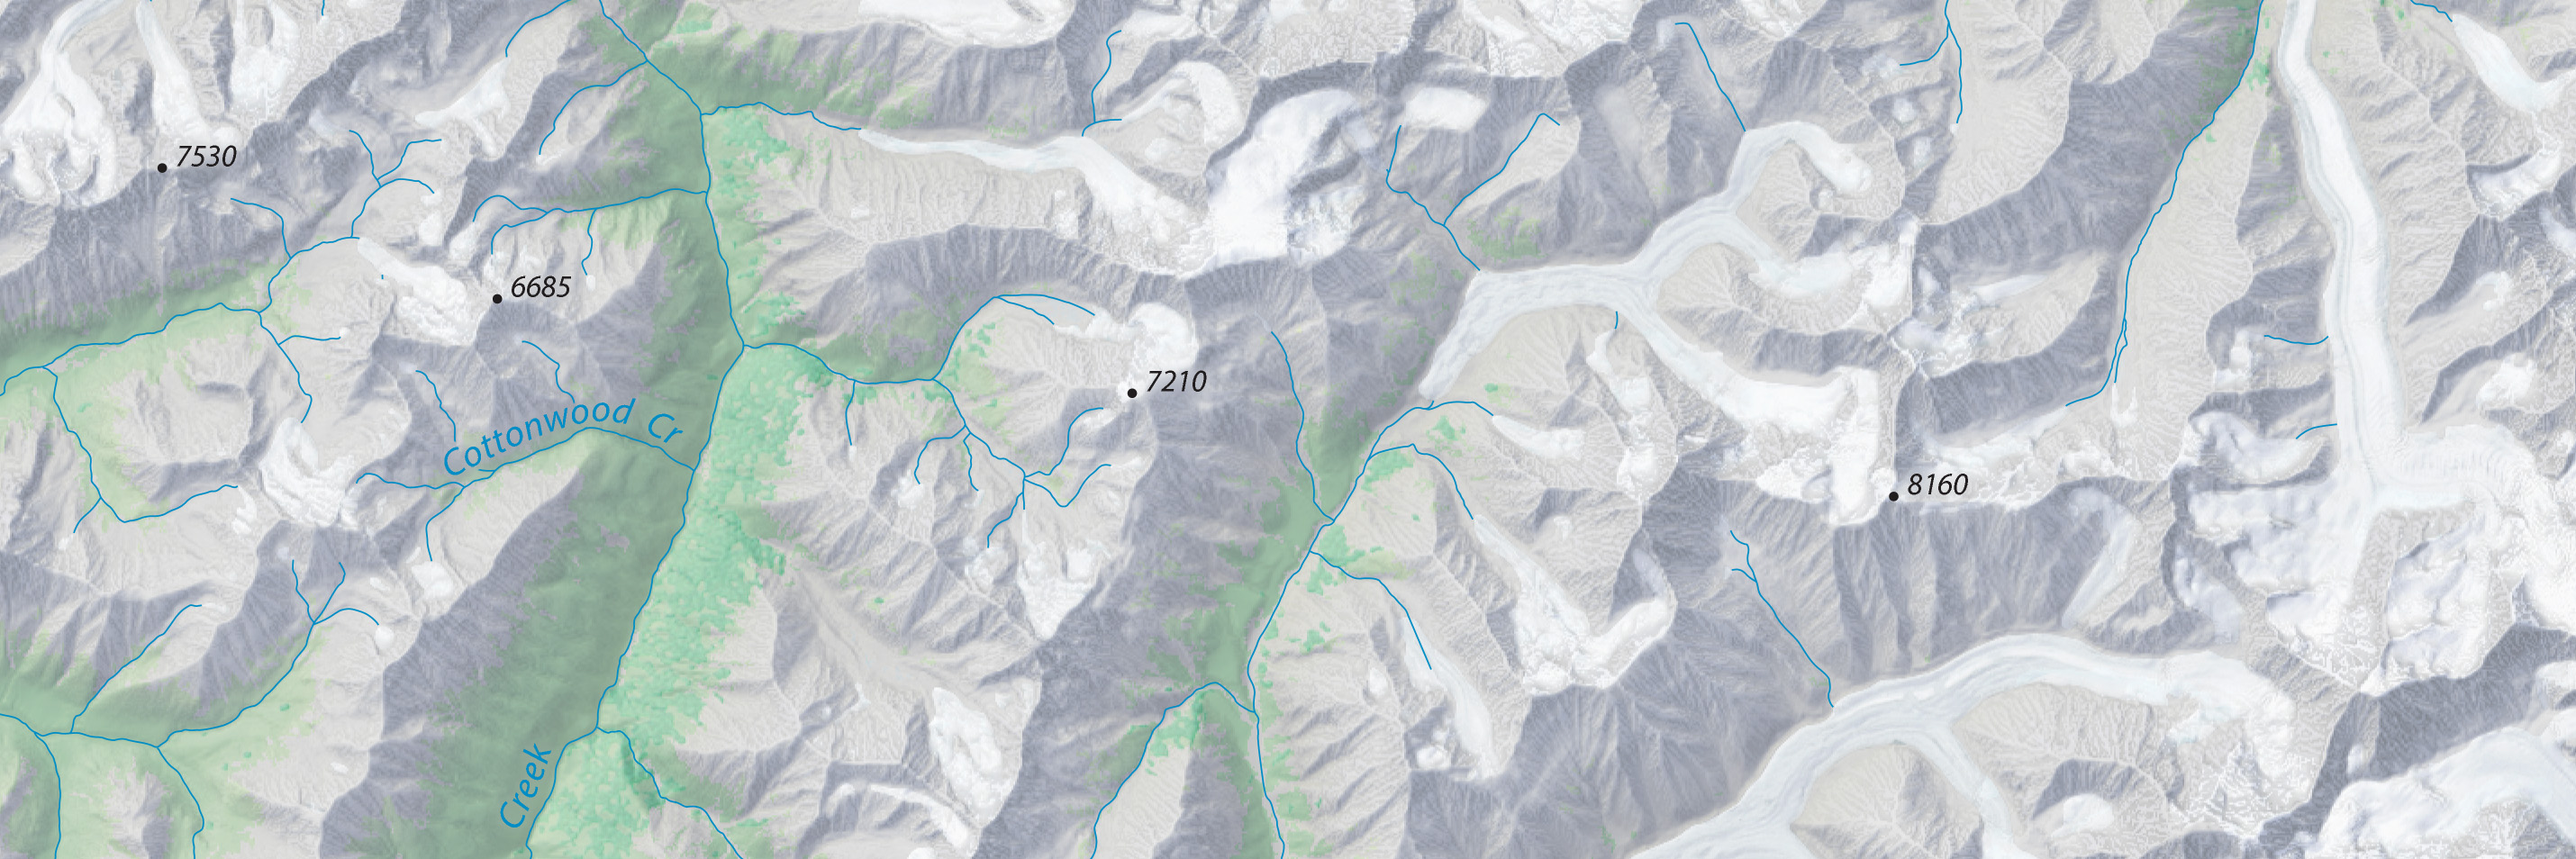
Rock textures - National Elevation Dataset, 5-meter IFSAR downsampled to 15 meters and rendered as texture shading. Upper elevations only.
Generalized land cover - National Land Cover Dataset, 30-meter resolution, 2011.
Terms of use
The Prince William Sound Wall Map is in the public domain. You may modify the content, reproduce it on any type of media, and sell it for profit. Consider it as yours.
By downloading and using this map you agree that the map author (Tom Patterson) is not legally responsible for any errors that the map may contain. You are solely responsible for all problems that may arise from reuse of the map and distribution to third parties. Tom Patterson does not endorse the individuals or organizations that may use the map, nor does he endorse their positions on various issues.
This map is for general reference only. Do not use it for marine navigation, aerial navigation, or backcountry travel. Glaciers, rivers, lakes and coasts continually change position.
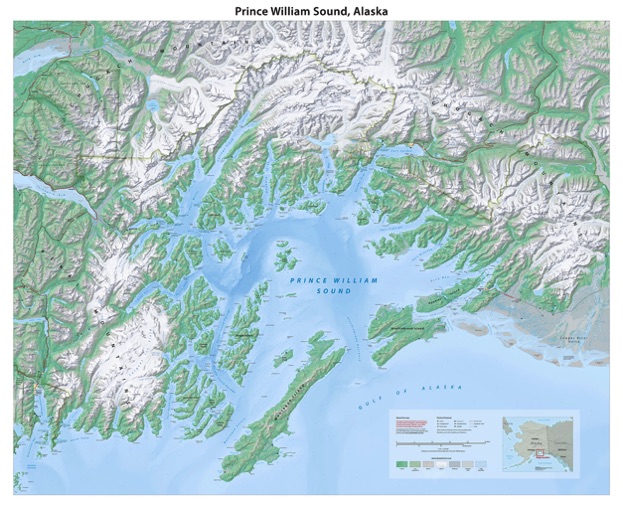
The map measures 44 x 36-inches at 1;250,000-scale. Projection: Universal Transverse Mercator, Zone 6N, NAD83 datum.

Mobile devices—locate yourself
The geolocated Prince William Sound map is available for free on the Avenza Maps app for iOS and Android.

Forest
Low vegetation
Barren
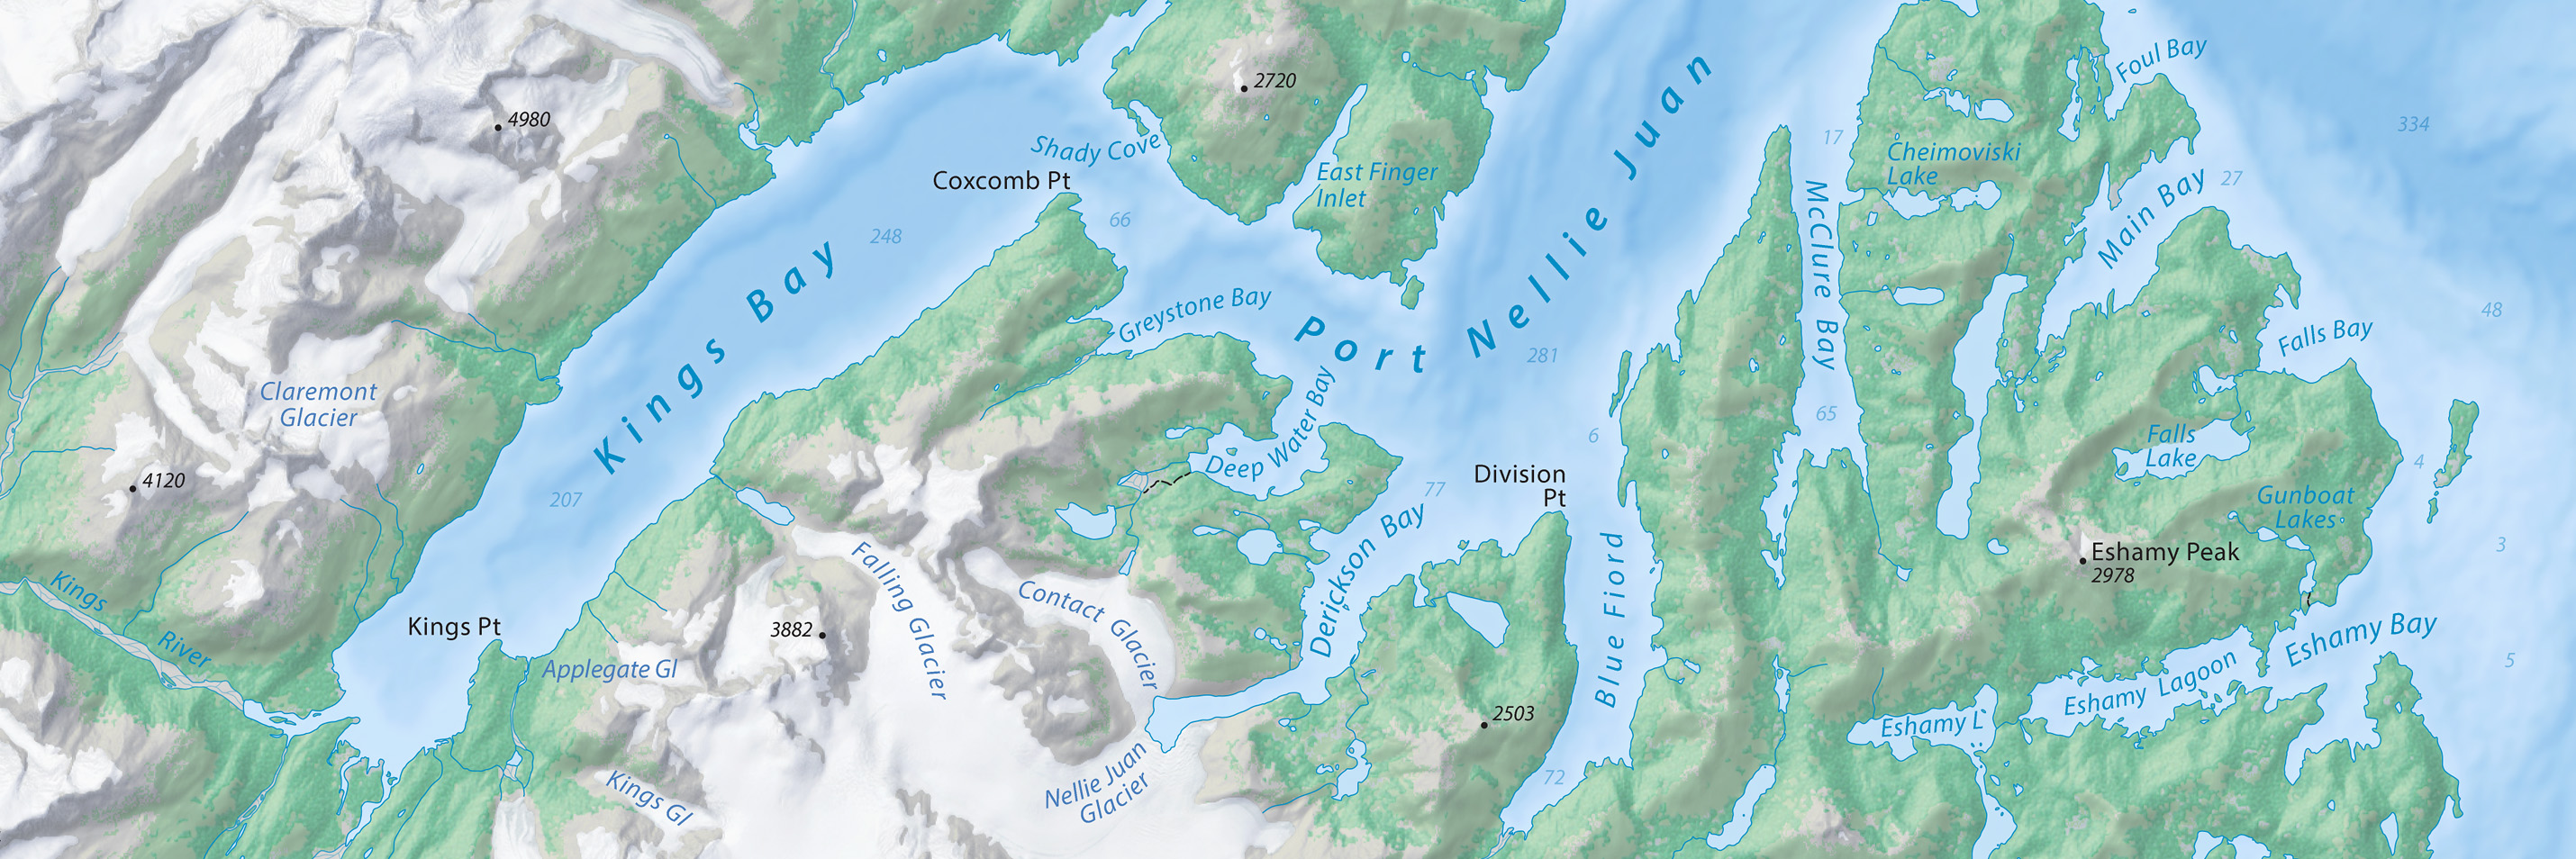
Glacier
Wetland
Braided river
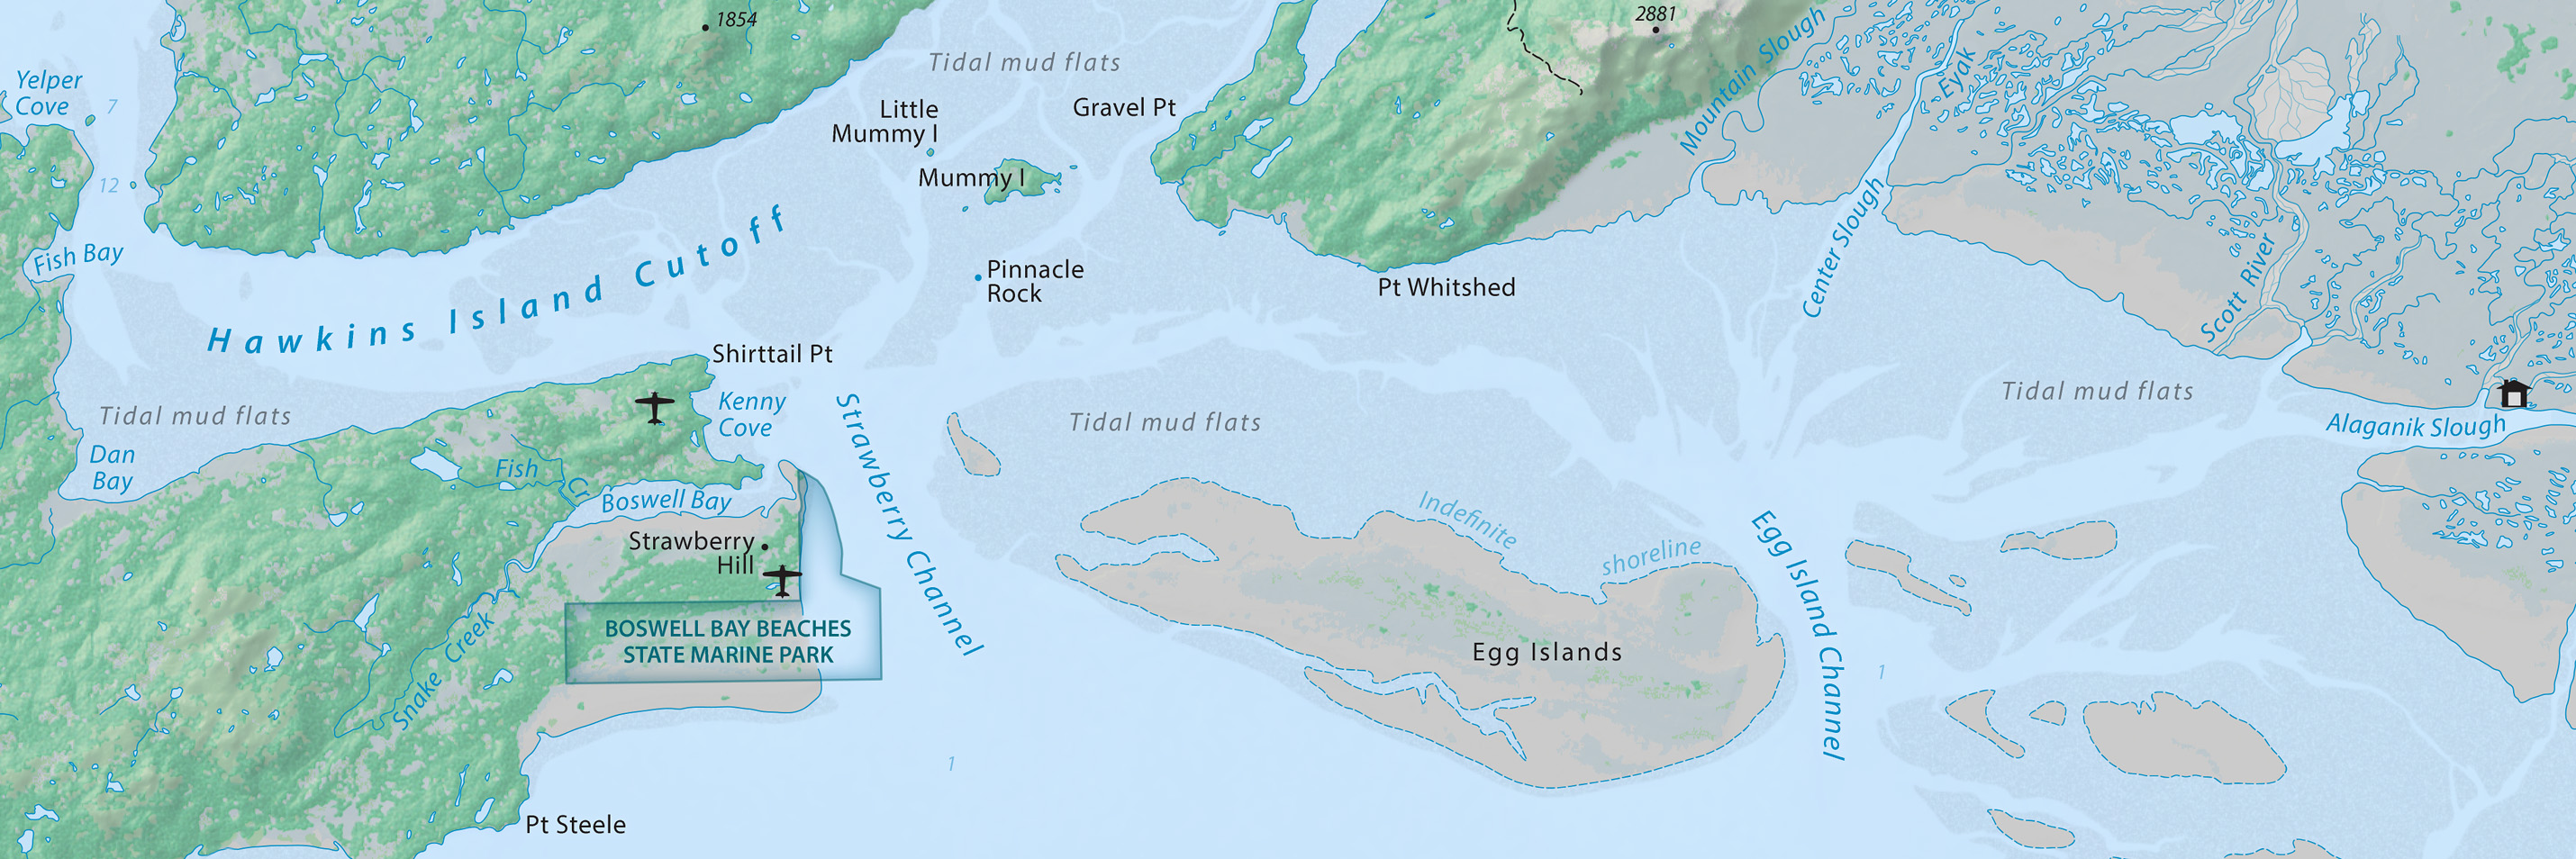
Tidal mud flat
Glaciers - National Hydro Dataset supplemented with interpretation from 2018, 2019, and 2023 Landsat and Sentinel images taken in late September. Glacier textures derive from a combination of Landsat (everywhere) and texture shading (upper elevations).
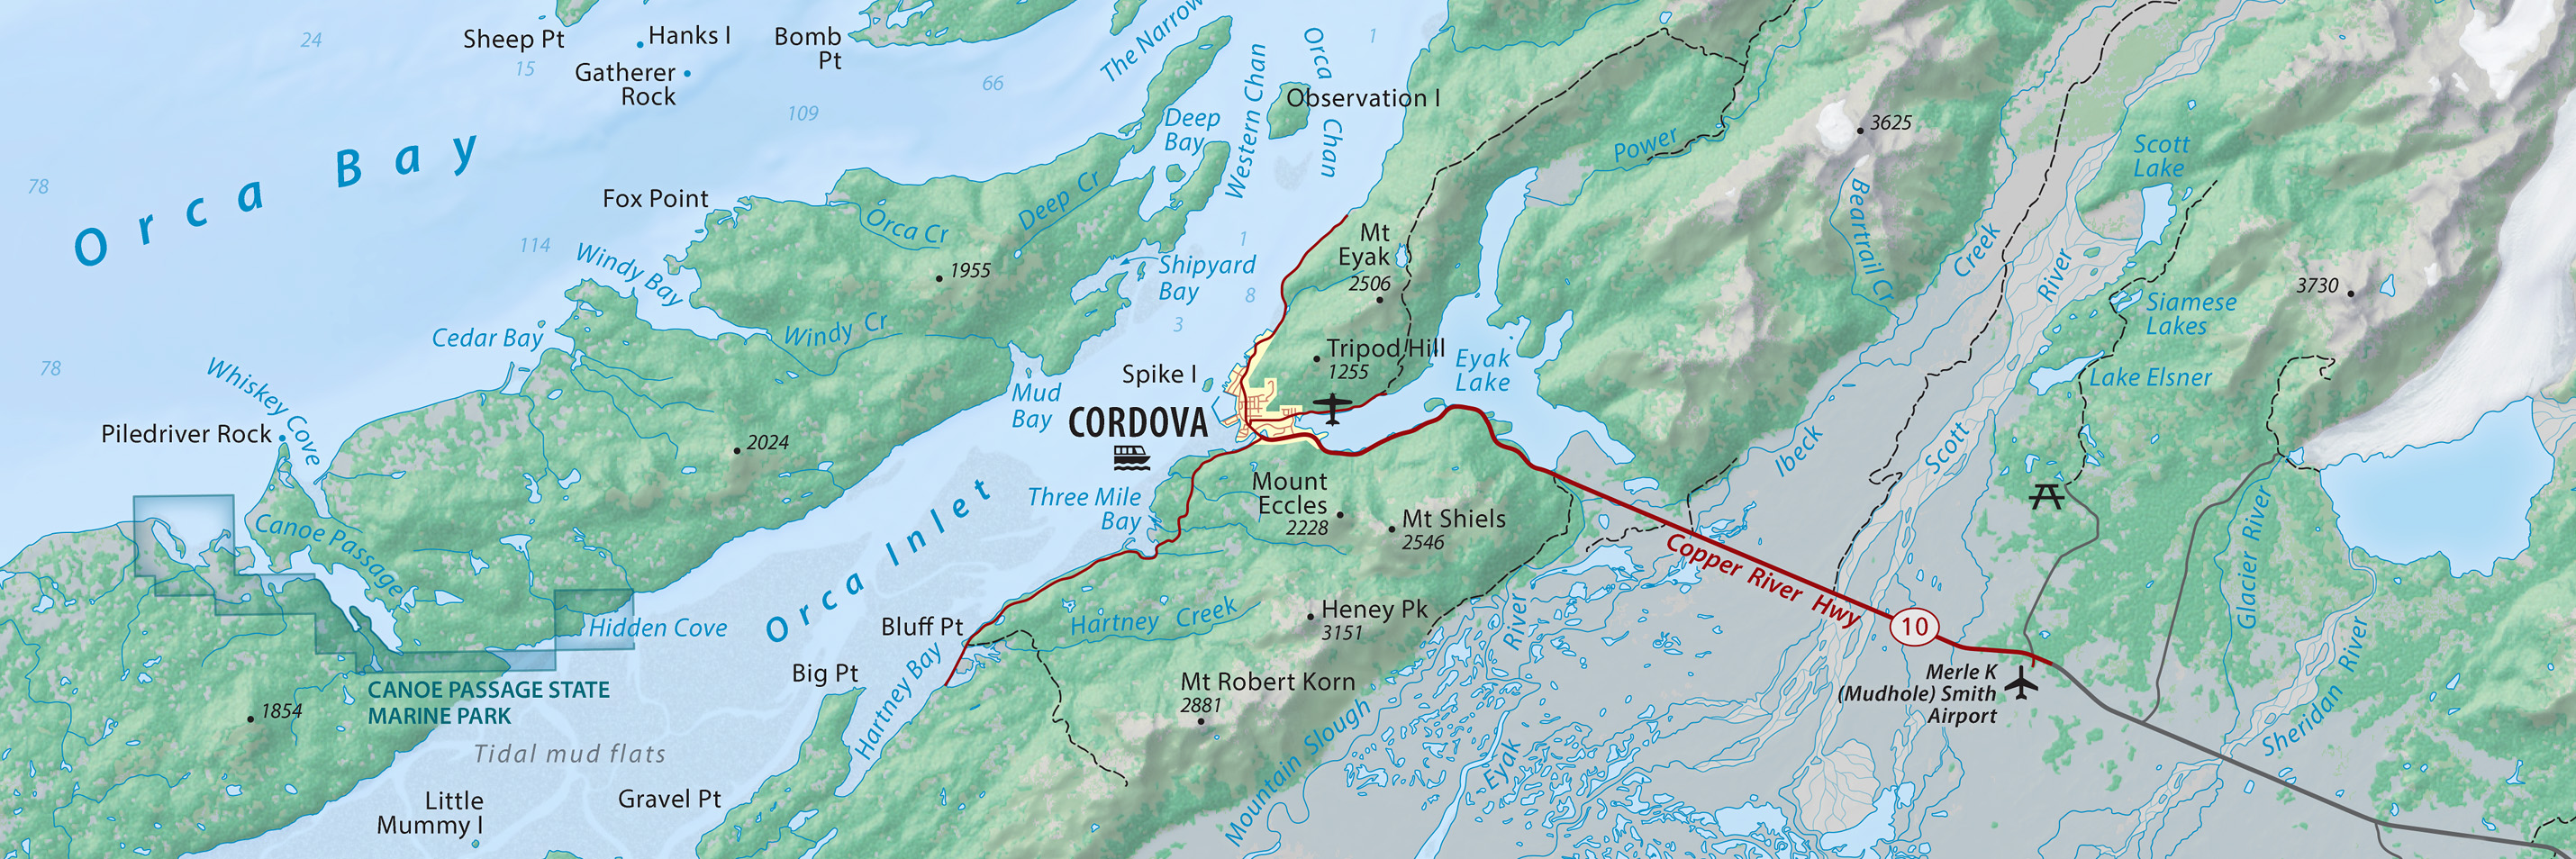
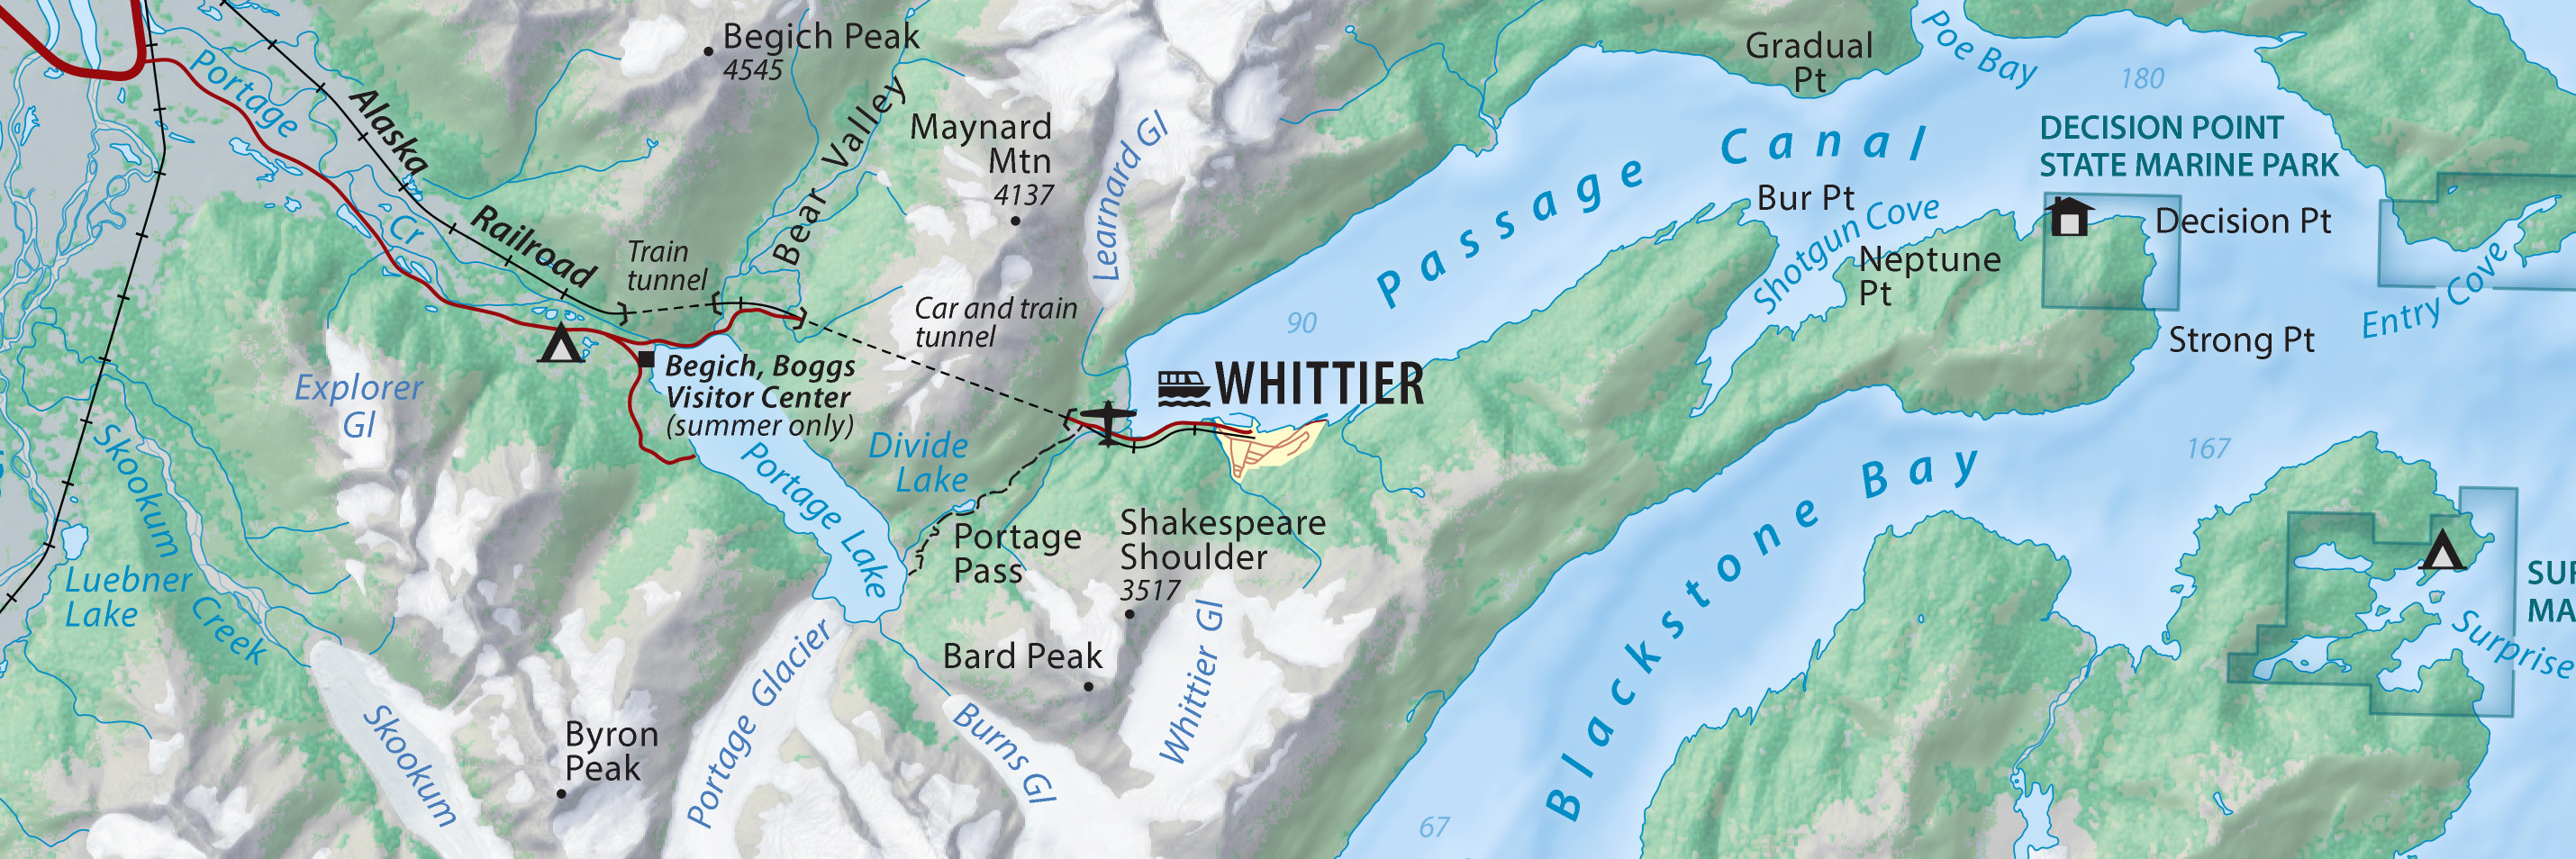
Rivers, lakes, and coasts - National Hydrography Dataset supplemented with interpretation from 2018 and 2019 Landsat images. Rivers were manually adjusted to better fit the shaded relief and extended upslope to emerge from glacier snouts. The minor interior channels within braided river extents are a pattern.
Tidal mud flats - 2019 Landsat images.
Labels - US Board on Geographic Names.
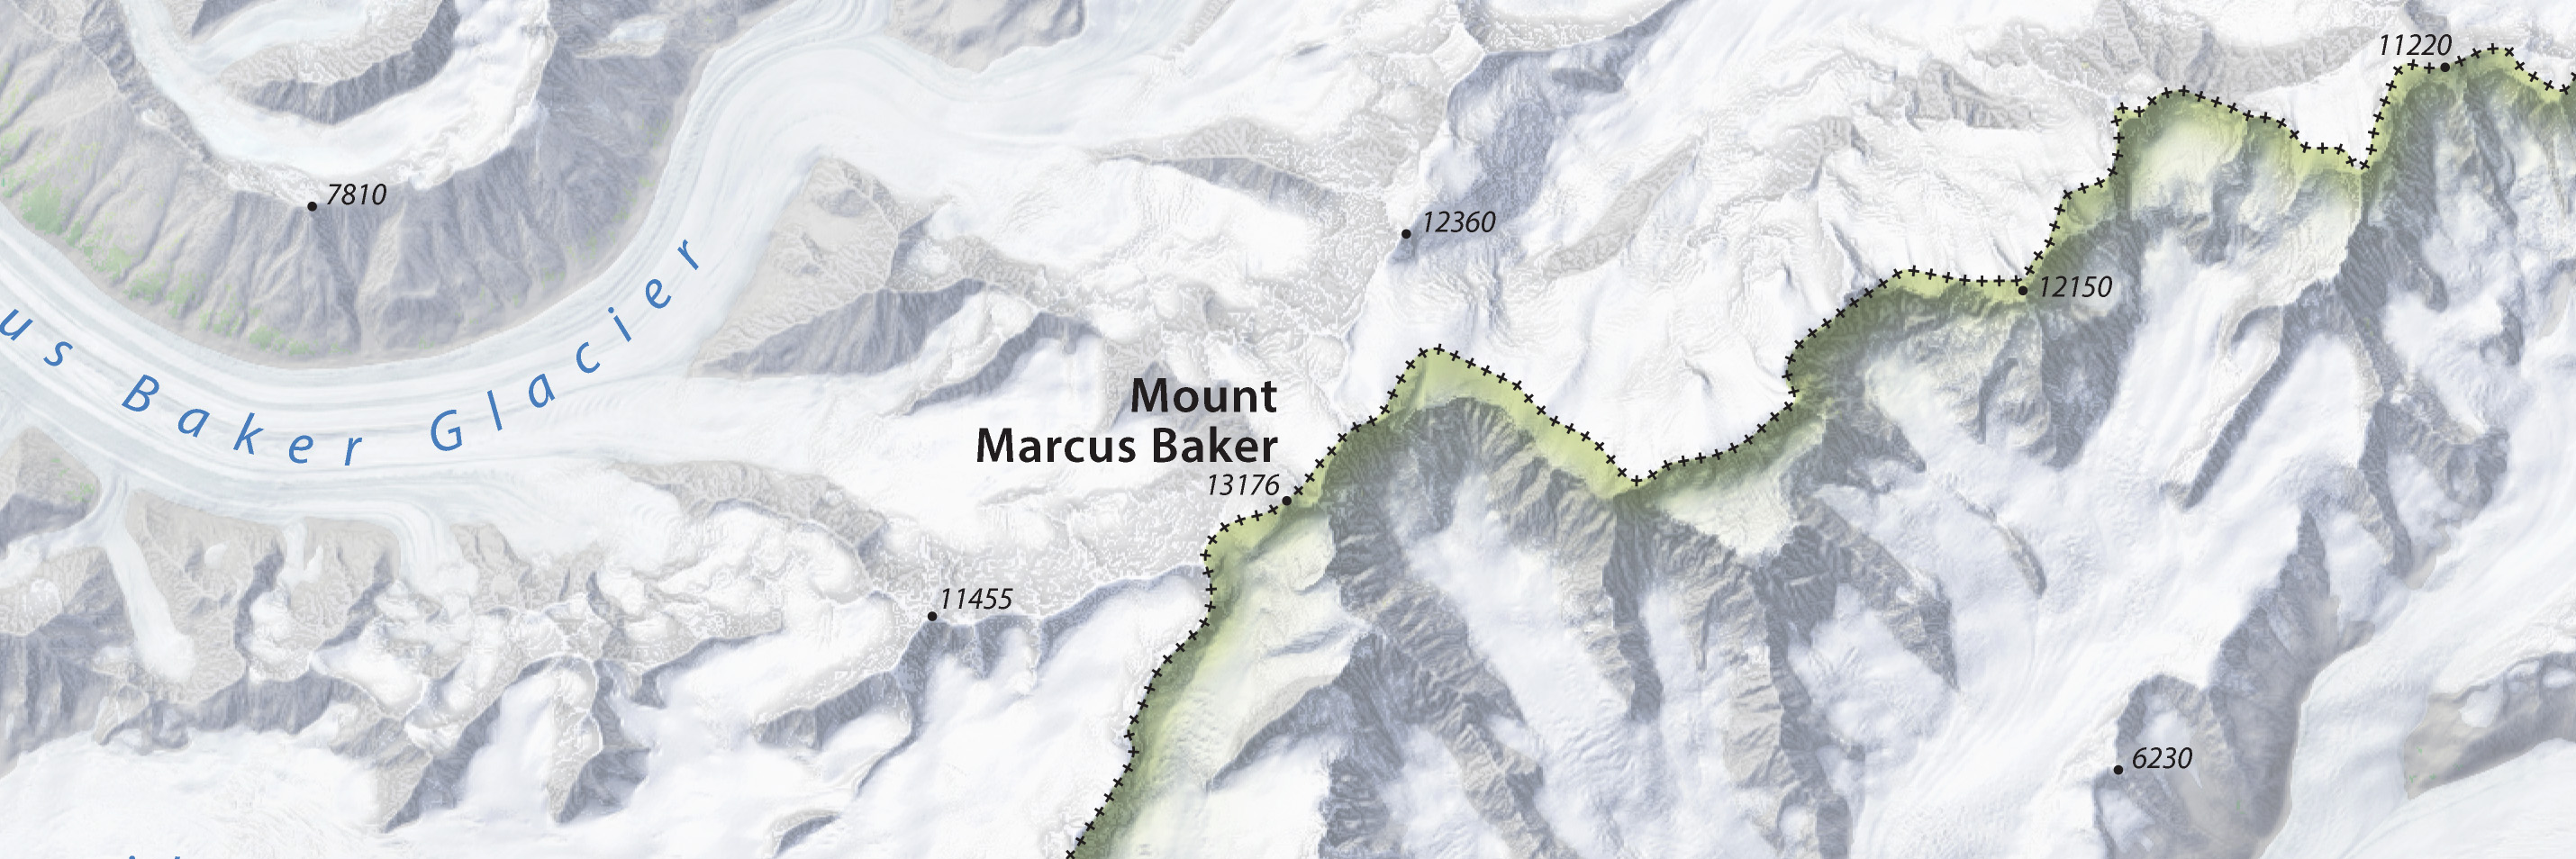
Mountain elevations - USGS printed topographic maps (1959-2000) and Wikipedia.
Bathymetry - 2009 NOAA 8/3 arc-second DEM.
Spot depths - 2019 NOAA chart, 1:200,000-scale.
Transportation - 2014 National Transporatation Dataset.
Points of interest - 2007 USDA Chugach National Forest map. The Alaska Department of Natural Resources website was another source. Selected sites shown only on public lands.
Acknowledgement
Jacob Hofman, National Forest Service, Alaska Regional Office, reviewed the map and identified important updates. Thank you. Any problems that may still exist are entirely my responsibility.